
Describe the main features of a chart, table, map or process in at least 150 words, in about 20 minutes. Start with a paraphrase of the task, give a clear overview of the main trends, then support it with key figures and comparisons. Do not give opinions or reasons.
At a glance
- Length
- At least 150 words
- Time
- About 20 minutes
- Weight
- Task 1 is worth half as much as Task 2
- Criteria
- Task Achievement, Coherence and Cohesion, Lexical Resource, Grammatical Range and Accuracy
How to do it
- Introduction: one sentence that paraphrases the task. Do not copy it word for word.
- Overview: two sentences on the biggest trends or differences, with no figures. Without an overview, Task Achievement is limited.
- Body paragraph 1: the most important feature, with figures and comparisons.
- Body paragraph 2: the next feature or group, again with selected figures.
- Use the right tense for the dates shown, and compare (higher than, twice as many, fell slightly) rather than listing numbers.
Common mistakes
- No overview, or an overview hidden at the end.
- Describing every number instead of selecting the important ones.
- Explaining causes or giving opinions, which the task does not ask for.
- Writing under 150 words, which caps your Task Achievement band.
A real practice task
From Skillora IELTS Academic Mock Test 1 · Writing Task 1
The bar chart below shows the percentage of household waste that was recycled in four countries in 2005, 2015 and 2025.
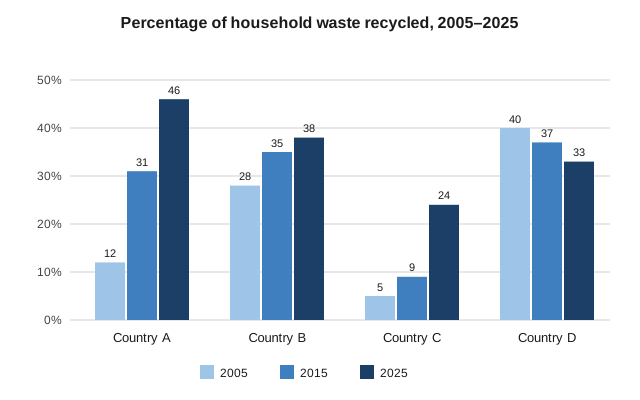
Summarise the information by selecting and reporting the main features, and make comparisons where relevant.
Write at least 150 words.
Practise it now. Every Skillora test explains every Listening and Reading answer, with the proof highlighted.
Practise Writing with AI marking →